Home
HomeChapter 11 Images:
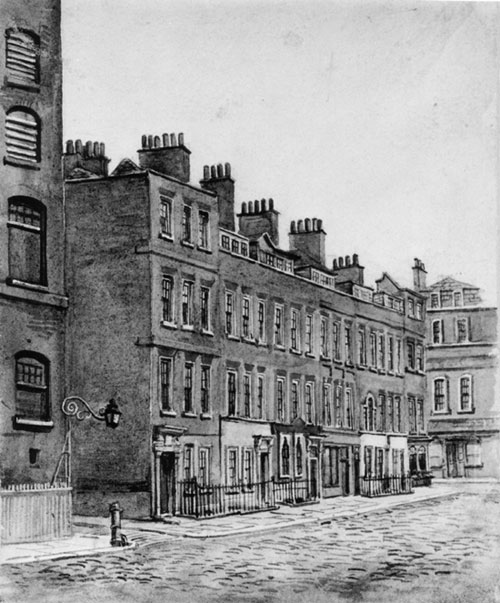 Figure 11.1. 16-21 Broad Street, 1888; currently 48-58 Broadwick Street (adapted from Frederick Calvert's watercolor, City of Westminster Archives, new house numbers from Sheppard, St. James Westminster, 2:216).
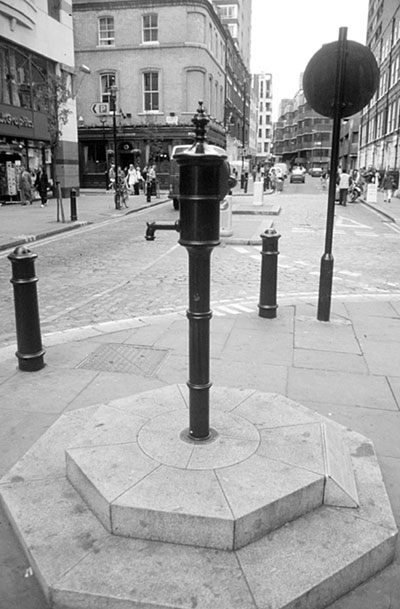 Figure 11.2. Broad Street pump, modern replica; Broadwick Street, London (photograph by authors).
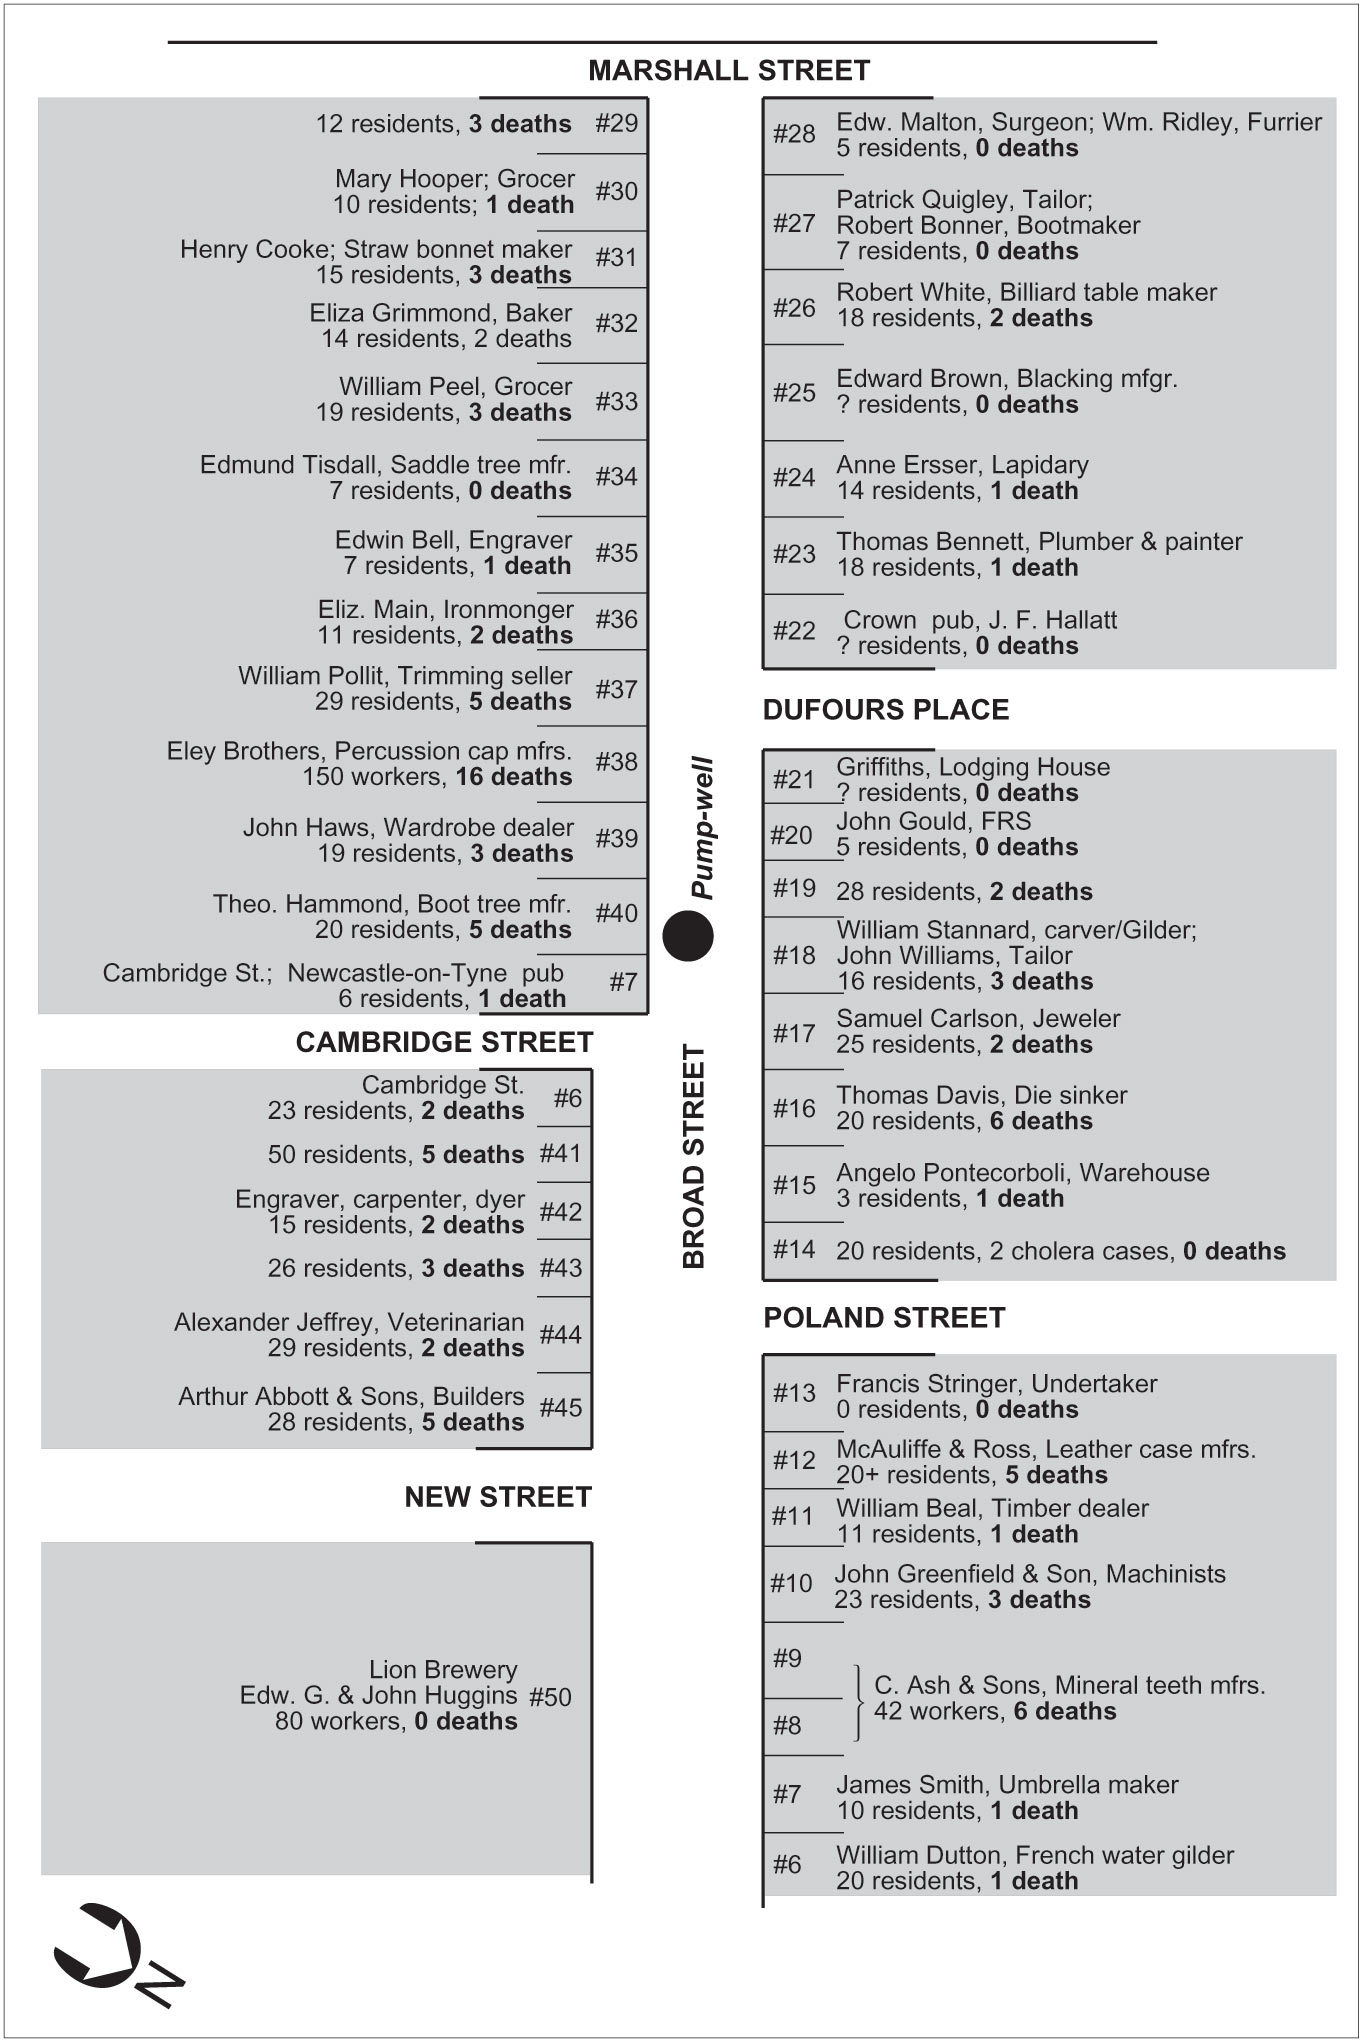 Figure 11.3.Diagram of the western portion of Broad Street showing principal businesses at each address, number of residents, and cholera deaths (adapted from GBH, Appendix to CSI, 343-46; Watkin's London Directory for 1855, 695).
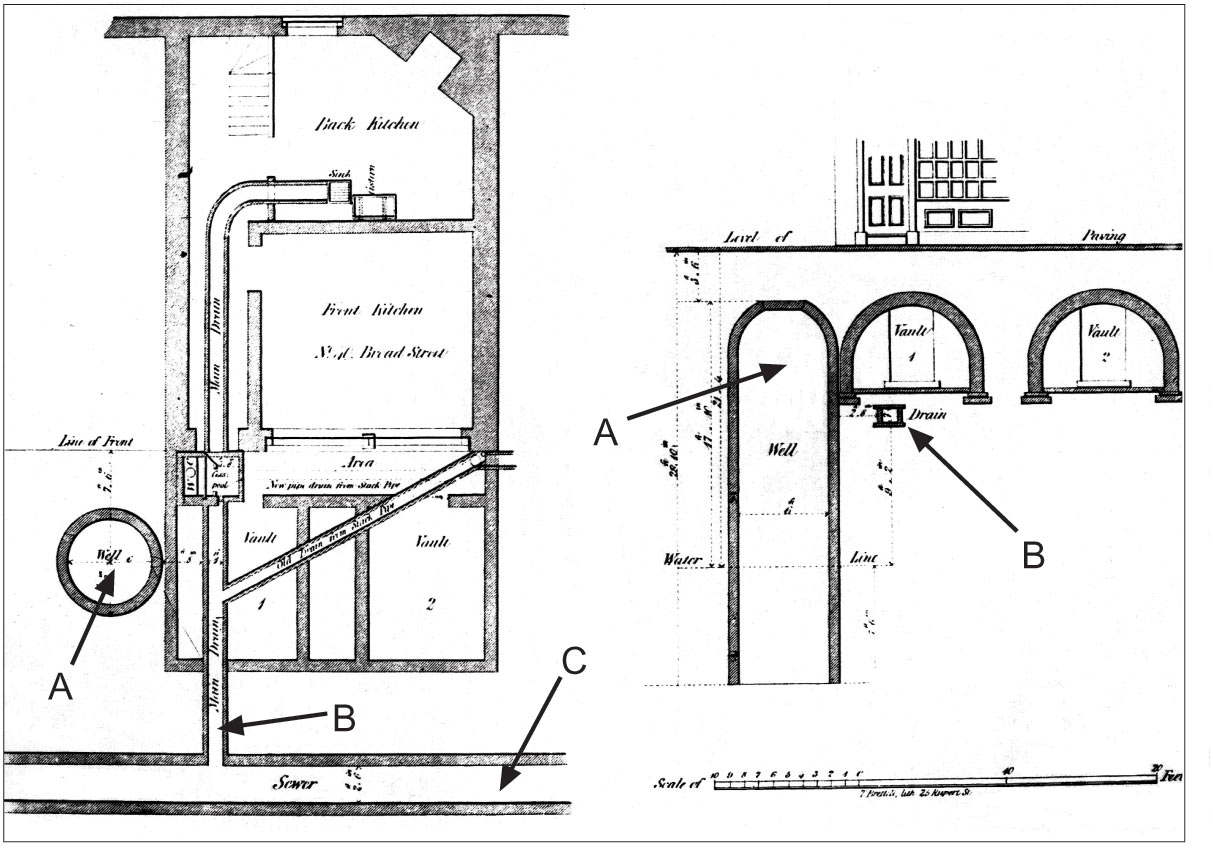 Figure 11.4. York's plan of the drain from 40 Broad Street and its position relative to the well under the Broad Street pump. Left: plan view, from above. Right: side view. A: well under pump; B: main drain from house; C: sewer (adapted from CIC, 170-71).
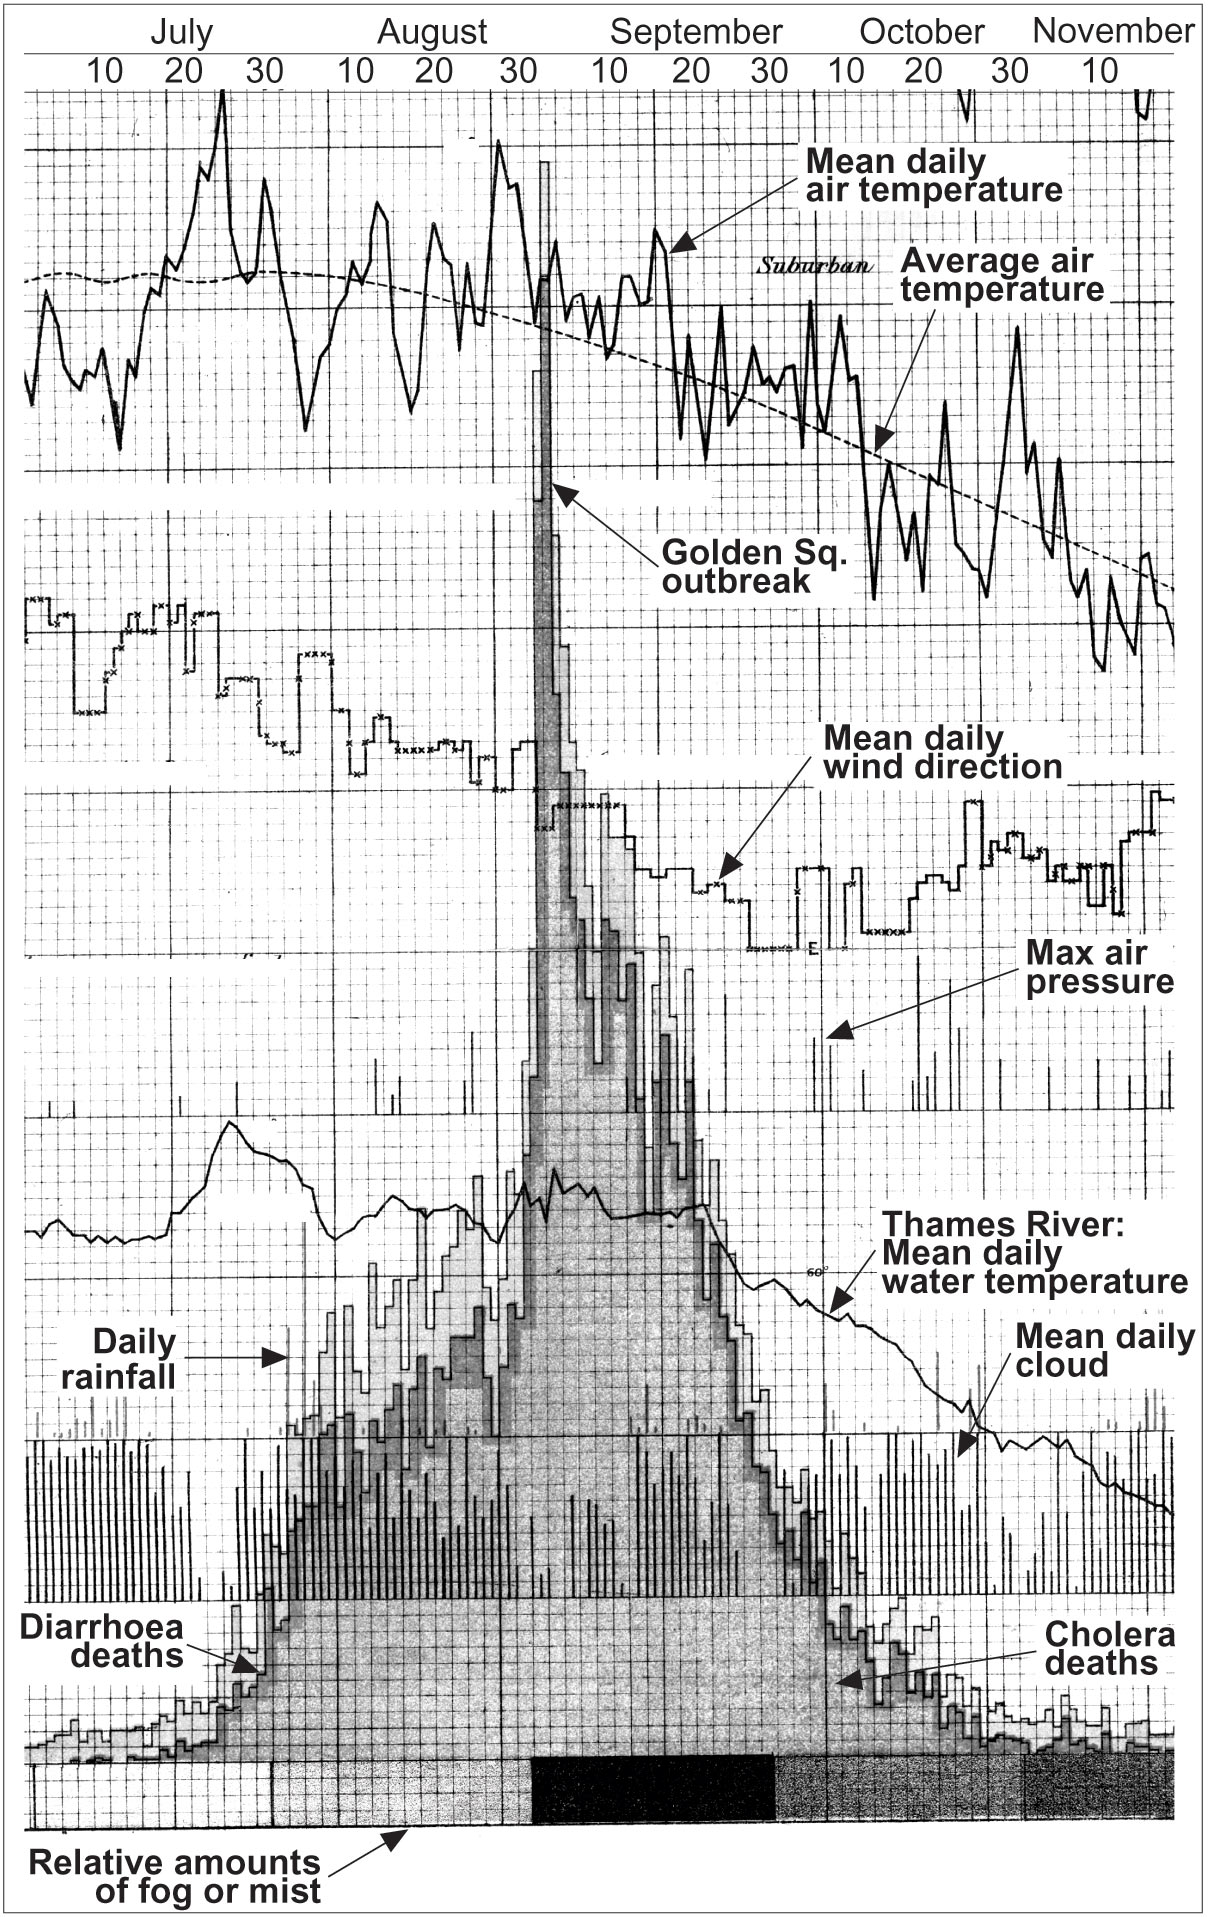 Figure 11.5. Cholera deaths per day in London, August-September 1854. The peak reflects a doubling of deaths during the ten-day outbreak in Golden Square. Meteorological data was entered on the graph for miasmatic analysis (adapted from GBH, Appendix to CSI, opposite 106).
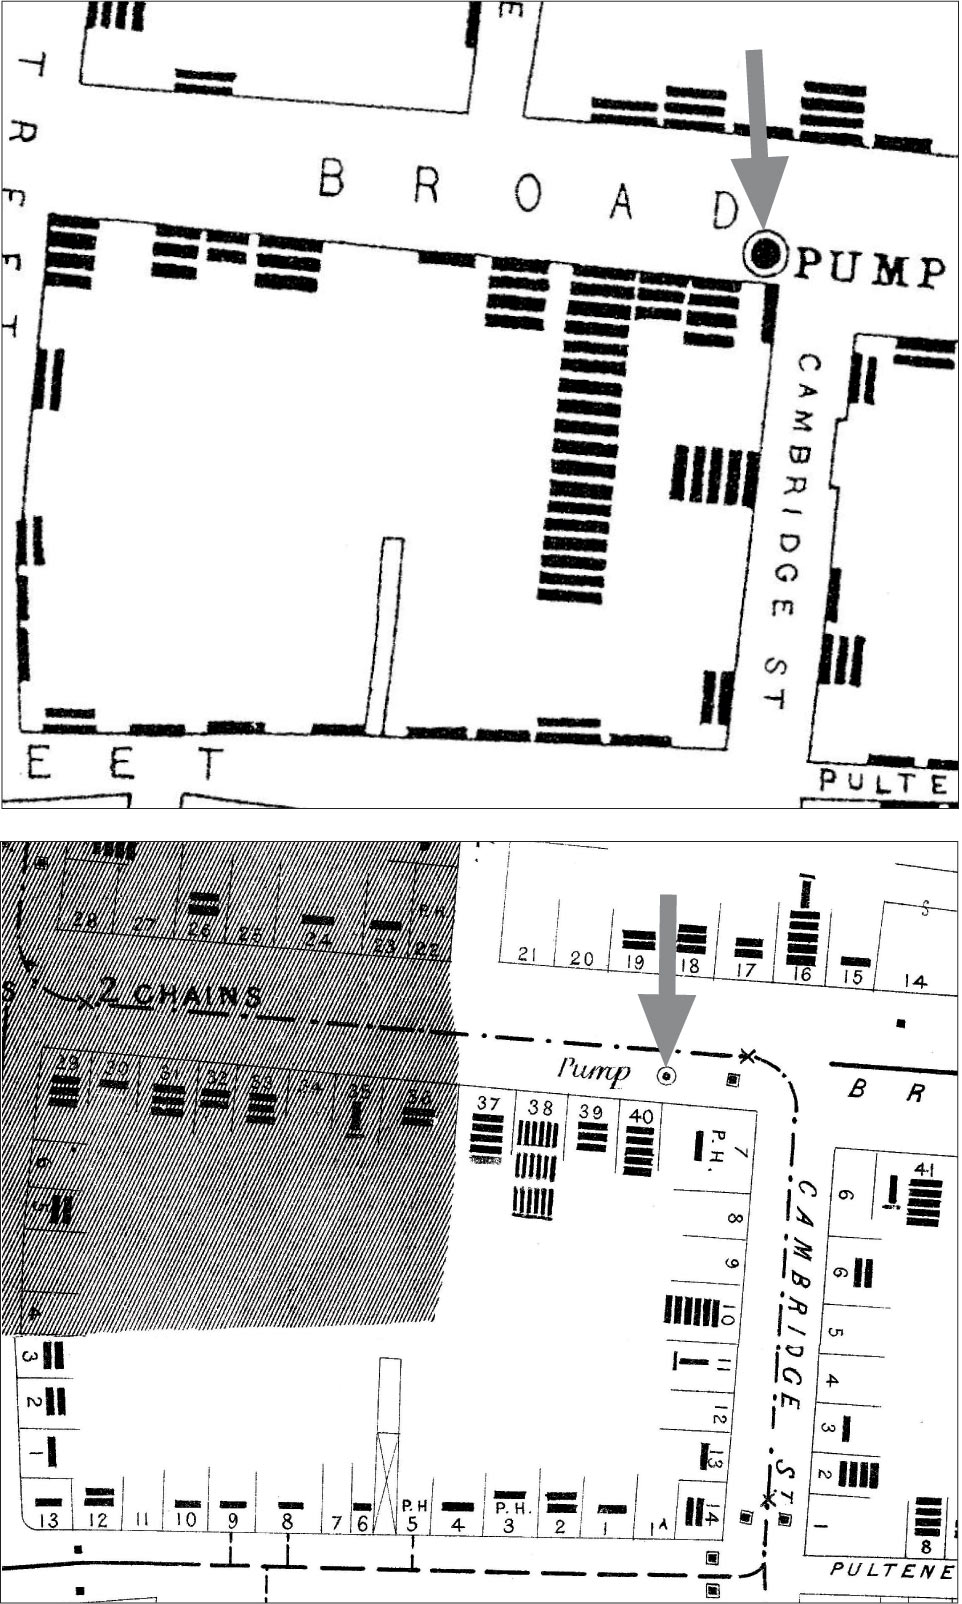 Figure 11.6. Number of deaths at 40 Broad Street: (top) Snow's MCC2 map, detail-number of bars identical in CIC map; (bottom) General Board of Health map, detail.